
")
")


HISTÓRIA DAS RELAÇÕES LABORAIS NO MUNDO LUSÓFONO
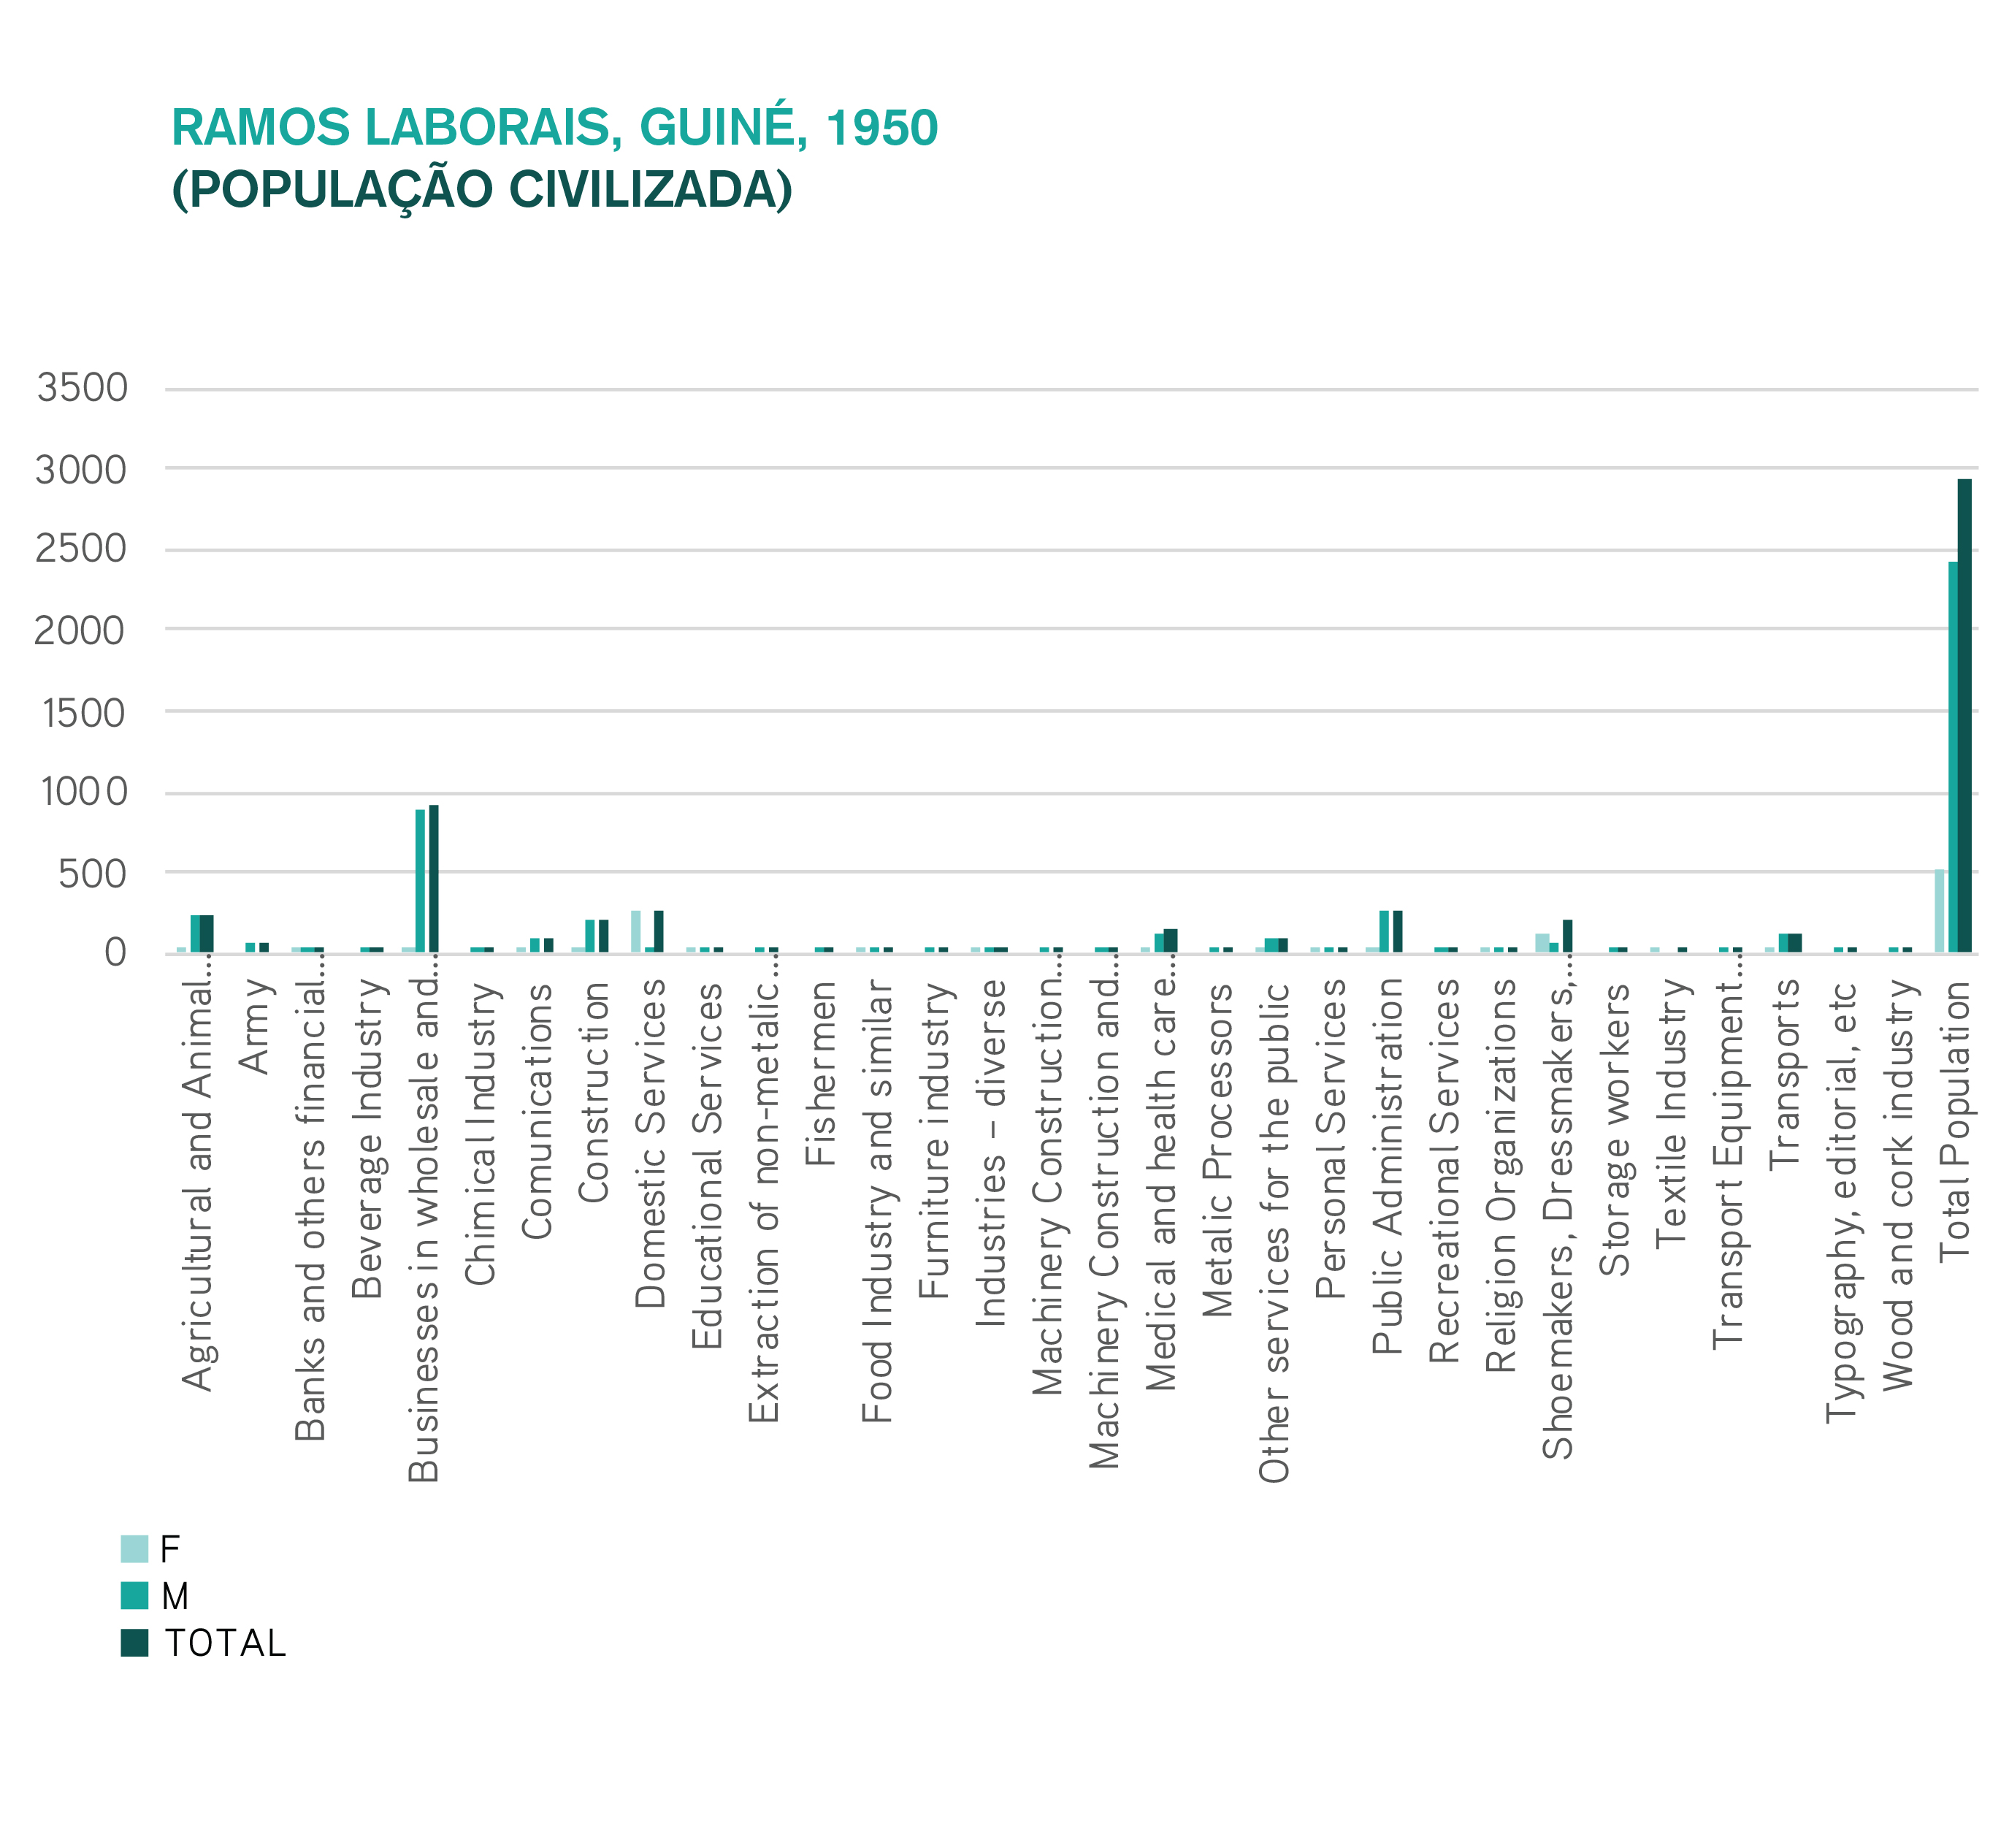
| Branch | F | M | Total | % Total |
|---|---|---|---|---|
| Agricultural and Animal Husbandry Workers | 4 | 234 | 238 | 8% |
| Army | 0 | 76 | 76 | 3% |
| Banks and others financial institutions | 1 | 25 | 26 | 1% |
| Beverage Industry | 0 | 2 | 2 | 0% |
| Businesses in wholesale and retail trade | 19 | 887 | 906 | 31% |
| Chimical Industry | 0 | 5 | 5 | 0% |
| Comunications | 14 | 84 | 98 | 3% |
| Construction | 2 | 214 | 216 | 7% |
| Domestic Services | 252 | 11 | 263 | 9% |
| Educational Services | 13 | 23 | 36 | 1% |
| Extraction of non-metalic minerals | 0 | 2 | 2 | 0% |
| Fishermen | 0 | 3 | 3 | 0% |
| Food Industry and similar | 2 | 6 | 8 | 0% |
| Furniture industry | 0 | 2 | 2 | 0% |
| Industries – diverse | 1 | 40 | 41 | 1% |
| Machinery Construction (except electrical) | 0 | 34 | 34 | 1% |
| Machinery Construction and other electrical material | 0 | 3 | 3 | 0% |
| Medical and health care services | 31 | 113 | 144 | 5% |
| Metalic Processors | 0 | 25 | 25 | 1% |
| Other services for the public | 10 | 91 | 101 | 3% |
| Personal Services | 2 | 16 | 18 | 1% |
| Public Administration | 12 | 260 | 272 | 9% |
| Recreational Services | 0 | 2 | 2 | 0% |
| Religion Organizations | 8 | 30 | 38 | 1% |
| Shoemakers, Dressmakers, etc. | 132 | 66 | 198 | 7% |
| Storage workers | 0 | 10 | 10 | 0% |
| Textile Industry | 10 | 0 | 10 | 0% |
| Transport Equipment Construction | 0 | 11 | 11 | 0% |
| Transports | 1 | 108 | 108 | 4% |
| Typography, editorial, etc | 0 | 35 | 35 | 1% |
| Wood and cork industry | 0 | 5 | 5 | 0% |
| Total Population | 514 | 2423 | 2936 | 100% |
| 1 to 10 (33) | ||||
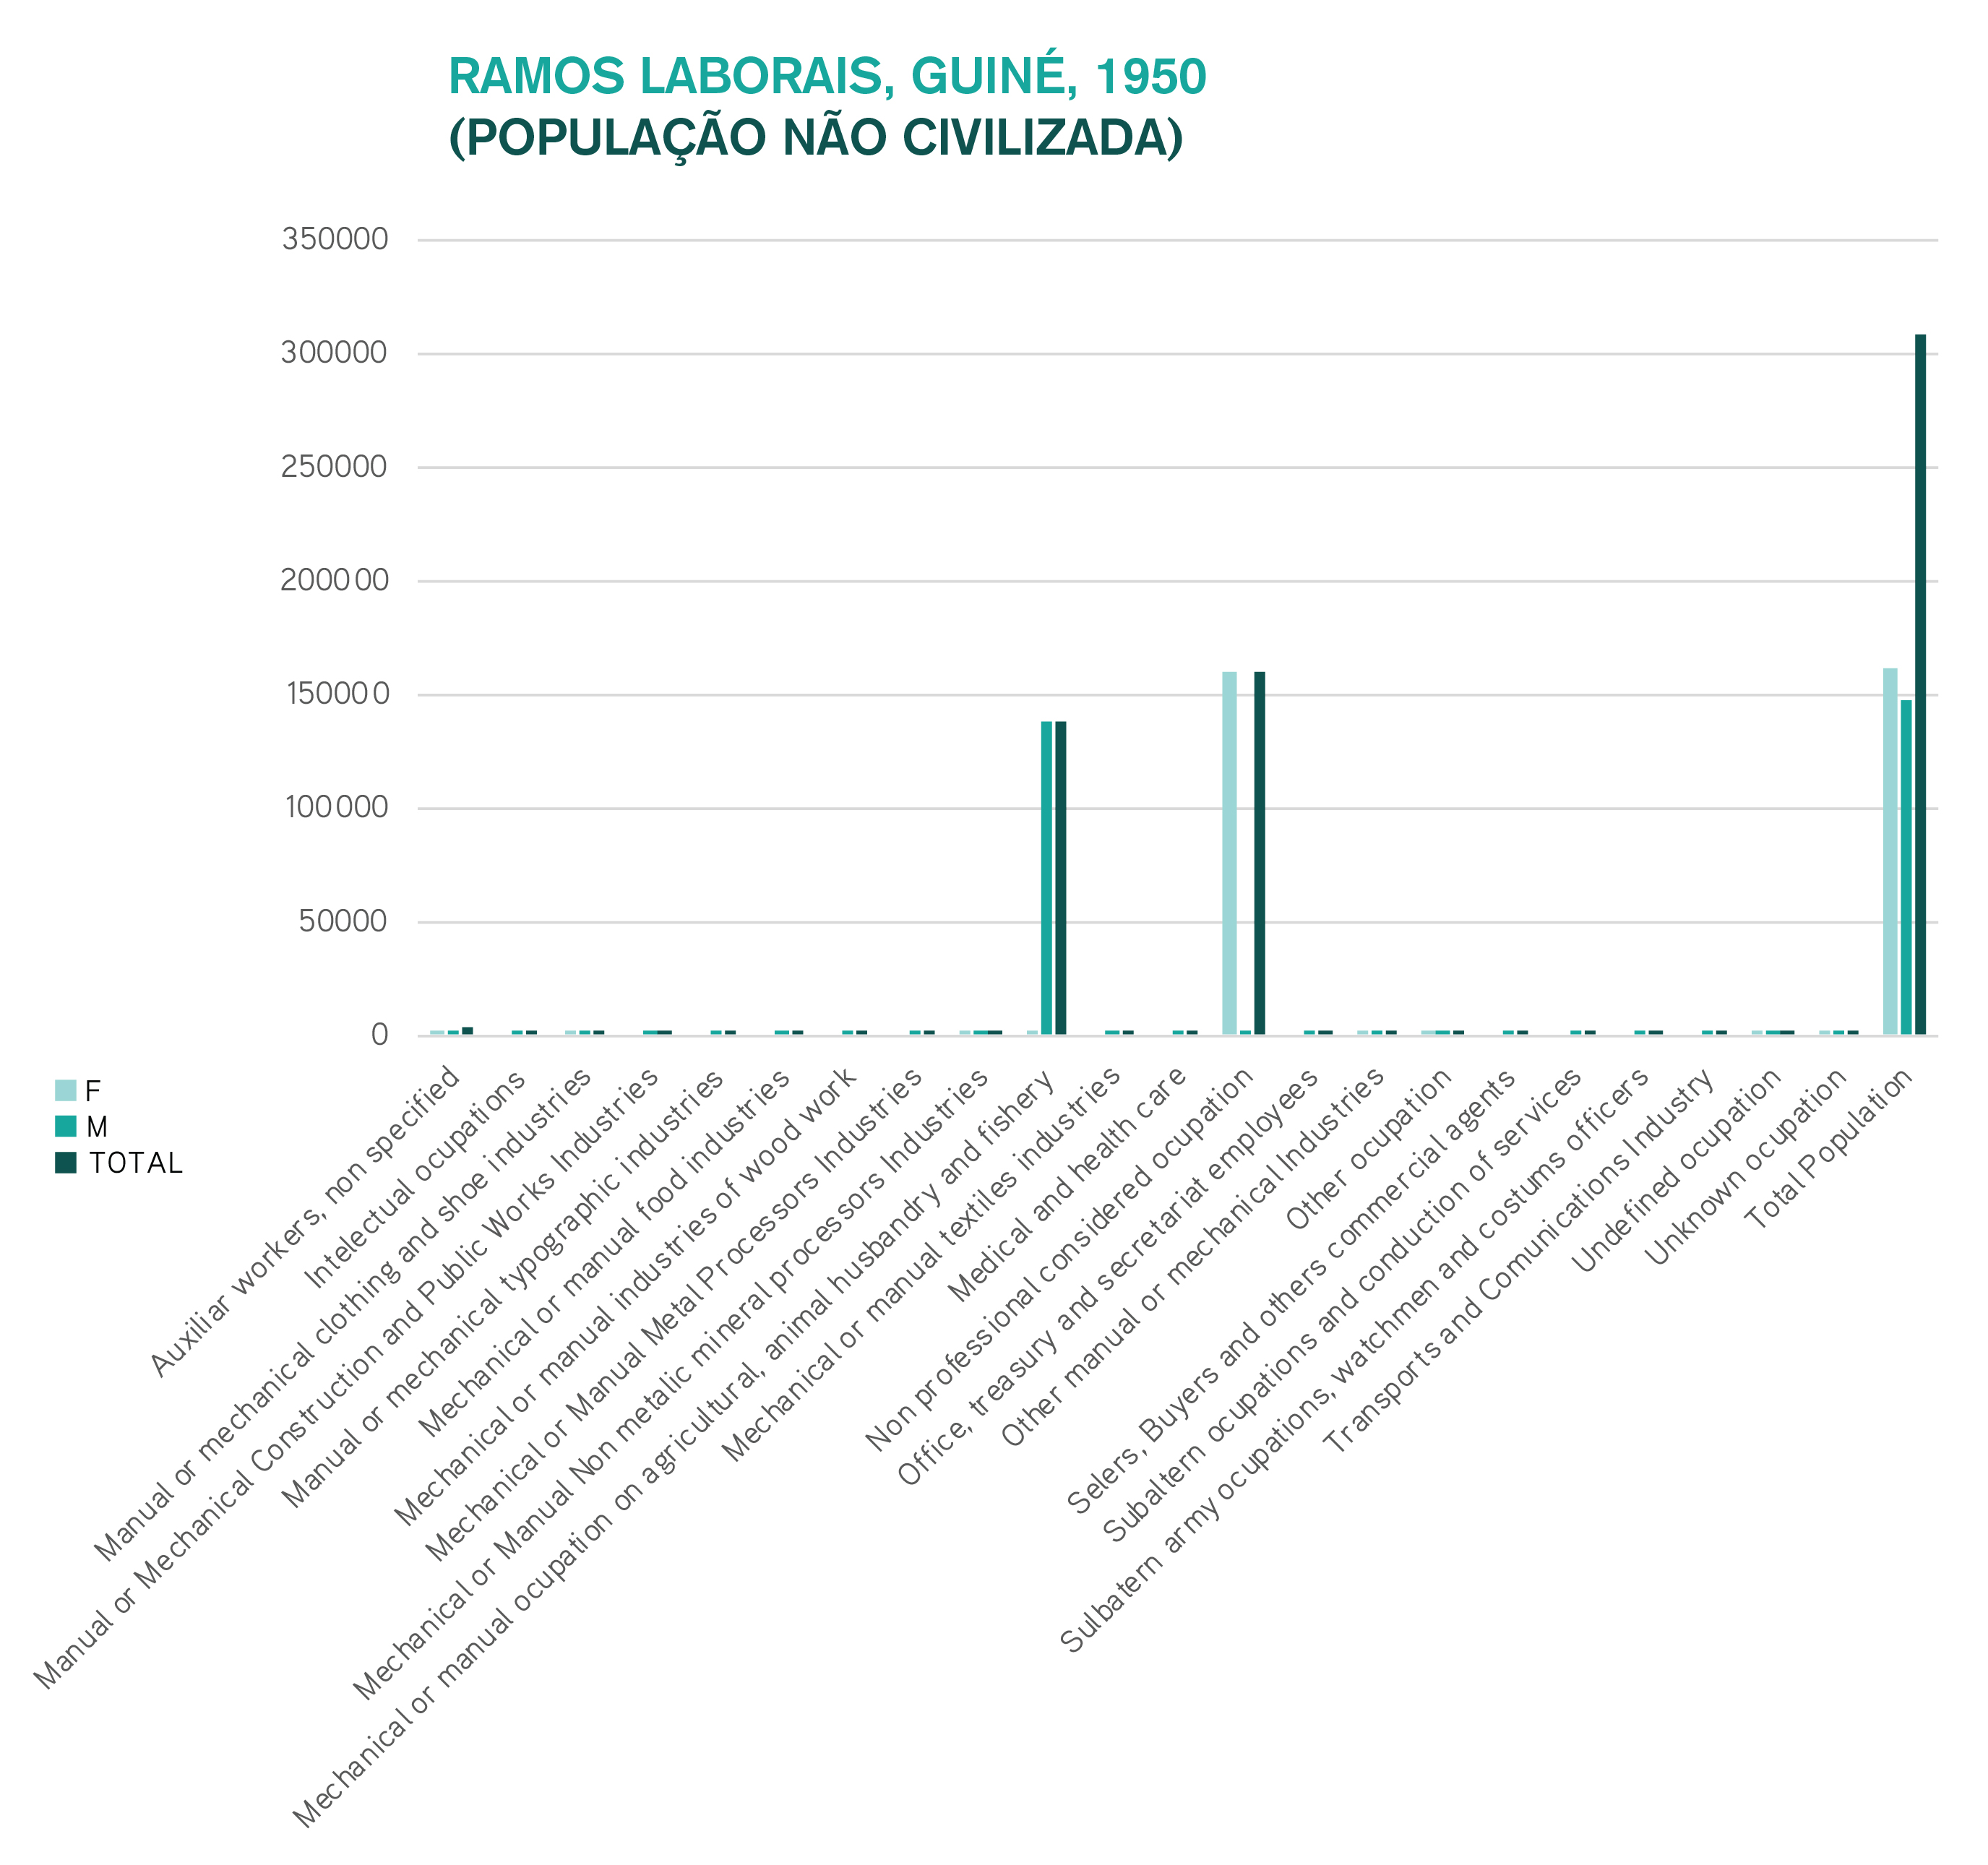
| Branch | F | M | Total | % Total |
|---|---|---|---|---|
| Auxiliar workers, non specified | 826 | 2417 | 3243 | 1% |
| Intelectual ocupations | 0 | 36 | 36 | 0% |
| Manual or mechanical clothing and shoe industries | 106 | 924 | 1030 | 0% |
| Manual or Mechanical Construction and Public Works Industries | 0 | 662 | 662 | 0% |
| Manual or mechanical typographic industries | 0 | 10 | 10 | 0% |
| Mechanical or manual food industries | 0 | 39 | 39 | 0% |
| Mechanical or manual industries of wood work | 0 | 1022 | 1022 | 0% |
| Mechanical or Manual Metal Processors Industries | 0 | 746 | 746 | 0% |
| Mechanical or Manual Non metalic mineral processors Industries | 35 | 4 | 39 | 0% |
| Mechanical or manual ocupation on agricultural, animal husbandry and fishery | 8 | 137598 | 137606 | 45% |
| Mechanical or manual textiles industries | 0 | 305 | 305 | 0% |
| Medical and health care | 0 | 12 | 12 | 0% |
| Non professional considered ocupation | 159690 | 31 | 159721 | 52% |
| Office, treasury and secretariat employees | 0 | 11 | 11 | 0% |
| Other manual or mechanical Industries | 235 | 255 | 490 | 0% |
| Other ocupation | 9 | 32 | 41 | 0% |
| Selers, Buyers and others commercial agents | 0 | 855 | 855 | 0% |
| Subaltern ocupations and conduction of services | 0 | 36 | 36 | 0% |
| Sulbatern army ocupations, watchmen and costums officers | 0 | 994 | 994 | 0% |
| Transports and Comunications Industry | 0 | 935 | 935 | 0% |
| Undefined ocupation | 42 | 145 | 187 | 0% |
| Unknown ocupation | 472 | 603 | 1075 | 0% |
| Total Population | 161423 | 147672 | 309095 | 100% |
| 1 to 10 (24) | ||||
| Labour Relations | F | % F | M | % M | Total | % T |
| -1 | 2380 | 29% | 941 | 11% | 3322 | 40% |
| 1 | 881 | 11% | 1004 | 12% | 1887 | 23% |
| 2 | 42 | 1% | 5 | 0% | 47 | 1% |
| 3 | 1 | 0% | 132 | 2% | 133 | 2% |
| 12 | 57 | 1% | 153 | 2% | 210 | 3% |
| 13 | 6 | 0% | 282 | 3% | 288 | 3% |
| 14 | 374 | 4% | 1276 | 15% | 1650 | 20% |
| 18 | 77 | 1% | 712 | 9% | 788 | 9% |
| Total Population | 3819 | 46% | 4501 | 54% | 8320 | 100% |
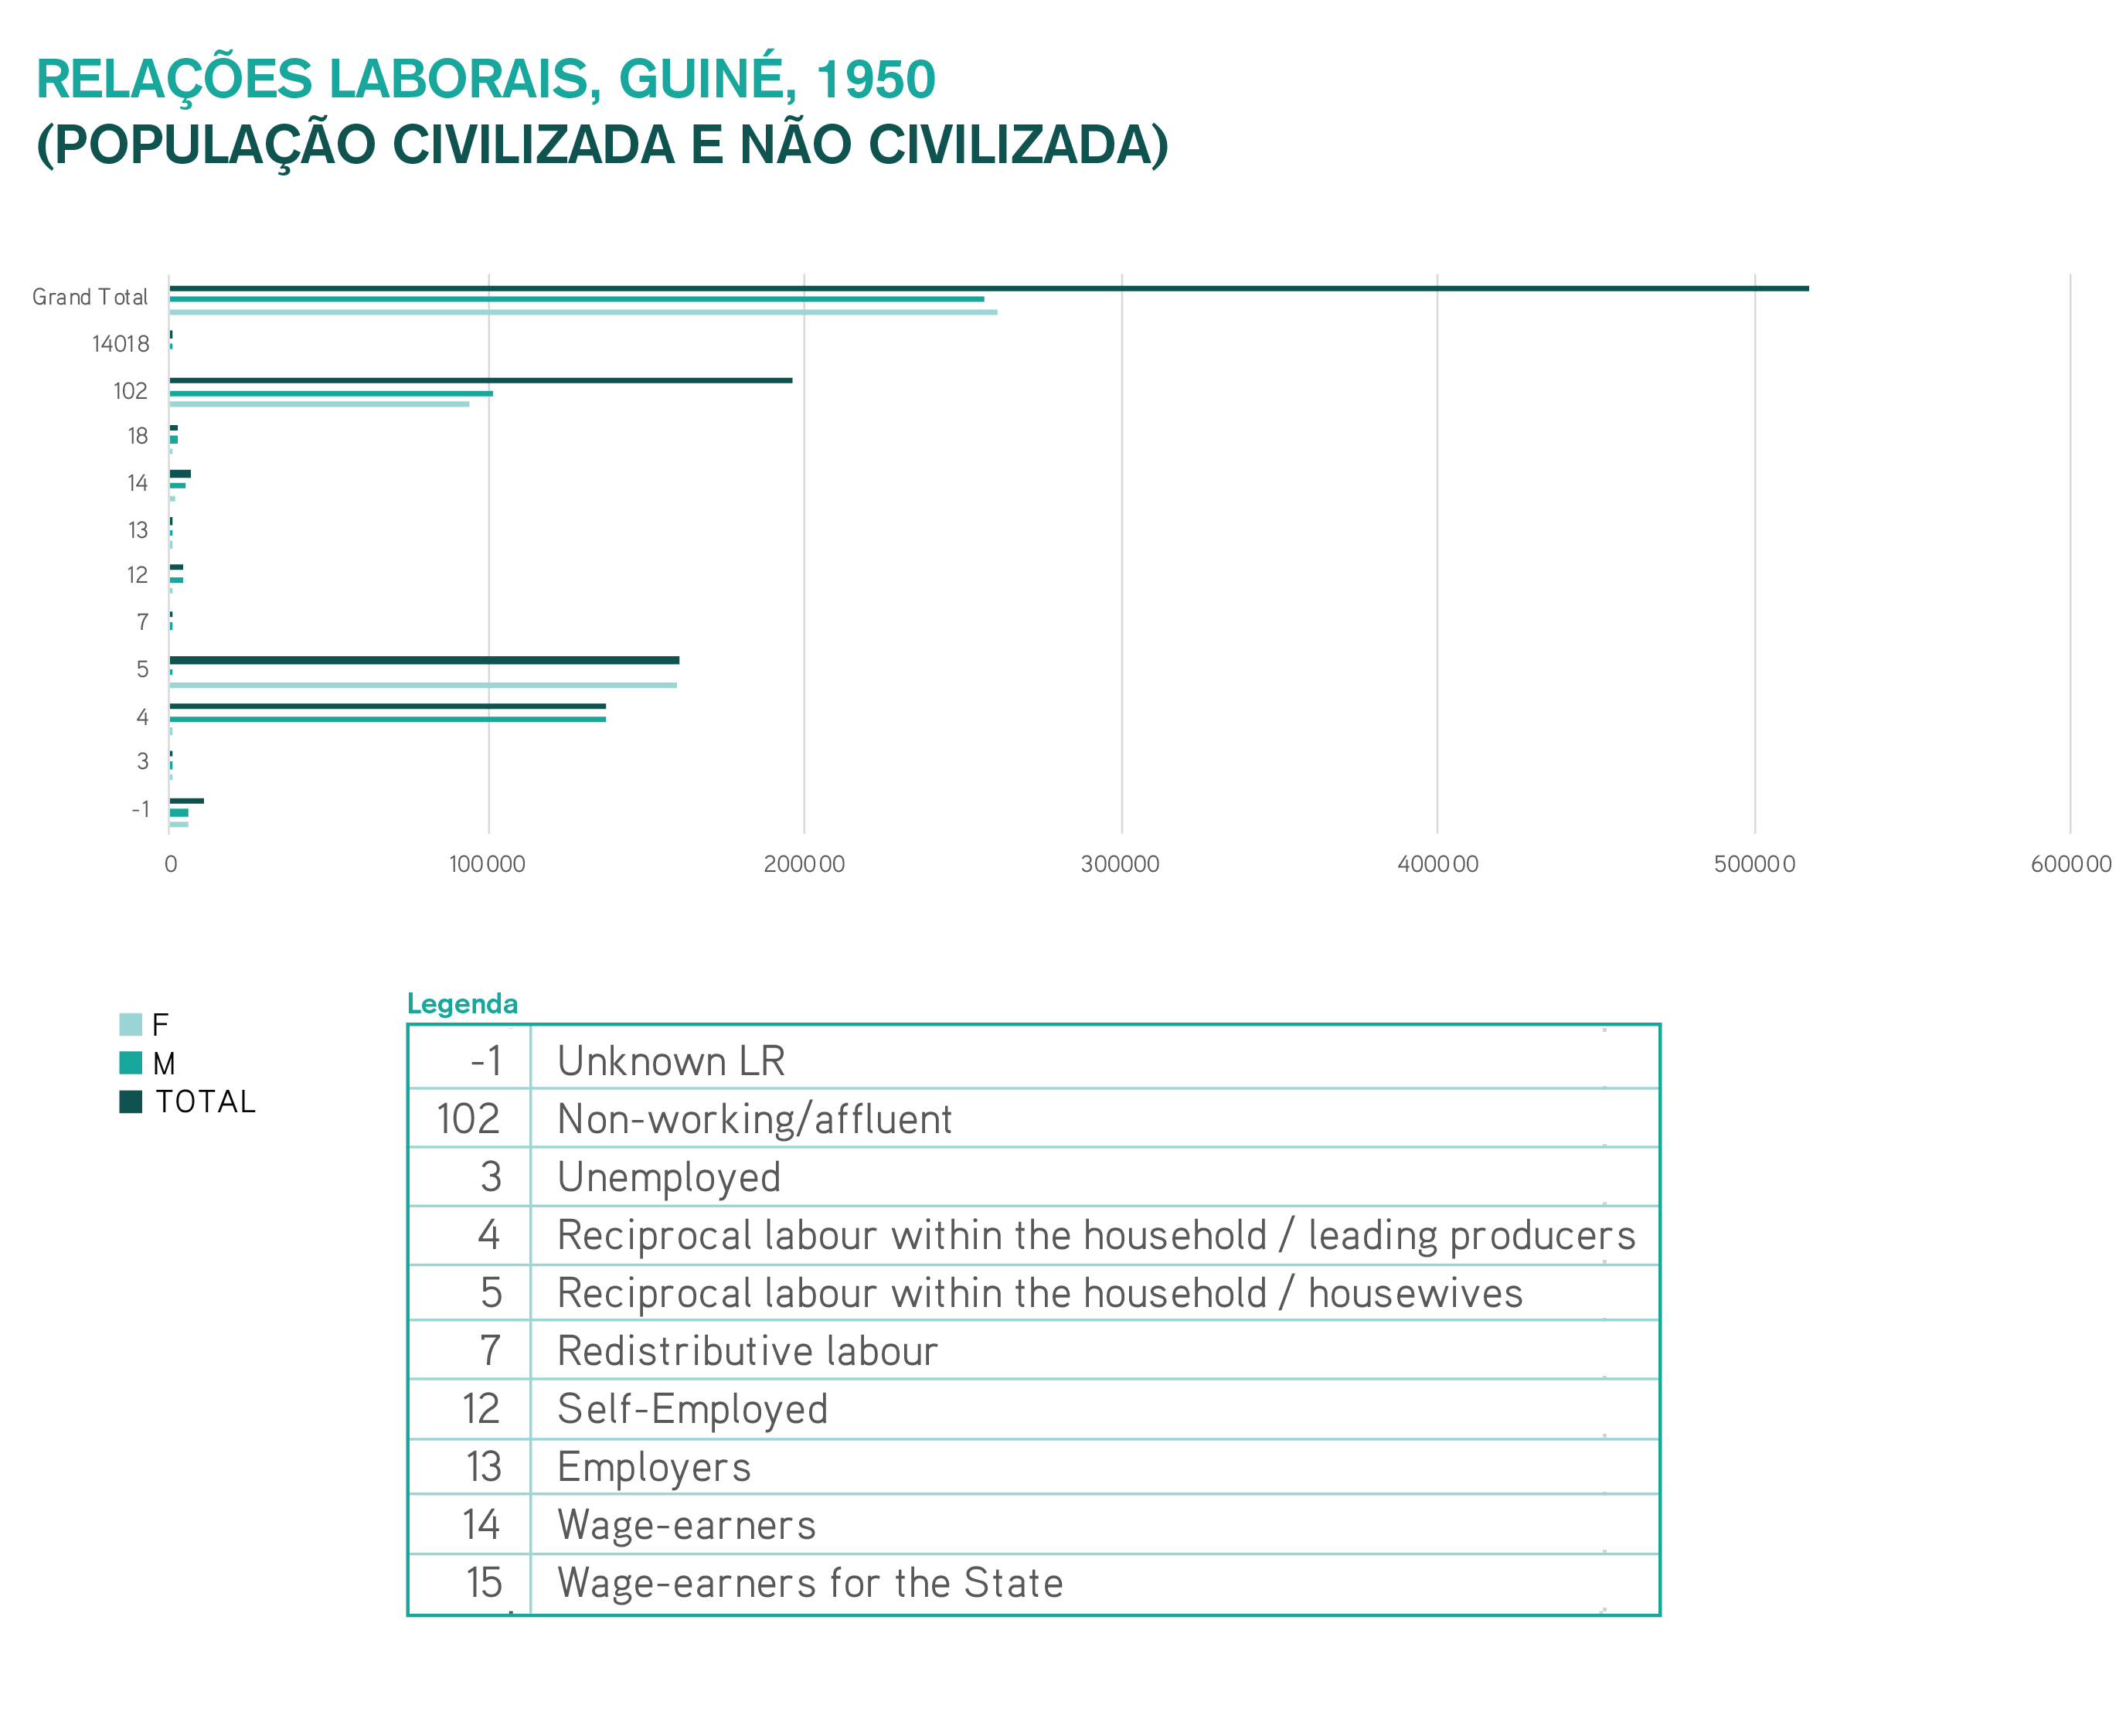
| Labour Relations | F | % F | M | % M | Total | % Total |
| -1 | 3207 | 1% | 4609 | 1% | 7816 | 2% |
| 102 | 92758 | 18% | 100548 | 20% | 193306 | 38% |
| 3 | 0 | 0% | 56 | 0% | 56 | 0% |
| 4 | 8 | 0% | 137592 | 27% | 137600 | 27% |
| 5 | 159853 | 31% | 866 | 1% | 160719 | 32% |
| 7 | 0 | 0% | 67 | 0% | 67 | 0% |
| 12 | 376 | 0% | 3386 | 1% | 3762 | 1% |
| 14 | 663 | 0% | 3627 | 1% | 4290 | 1% |
| 18 | 0 | 0% | 1024 | 0% | 1024 | 0% |
| 14018 | 0 | 0% | 330 | 0% | 330 | 0% |
| Total Population | 256865 | 51% | 252105 | 49% | 508970 | 100% |