HISTÓRIA DAS RELAÇÕES LABORAIS NO MUNDO LUSÓFONO

| 1808 | 1920 | 2000 | |
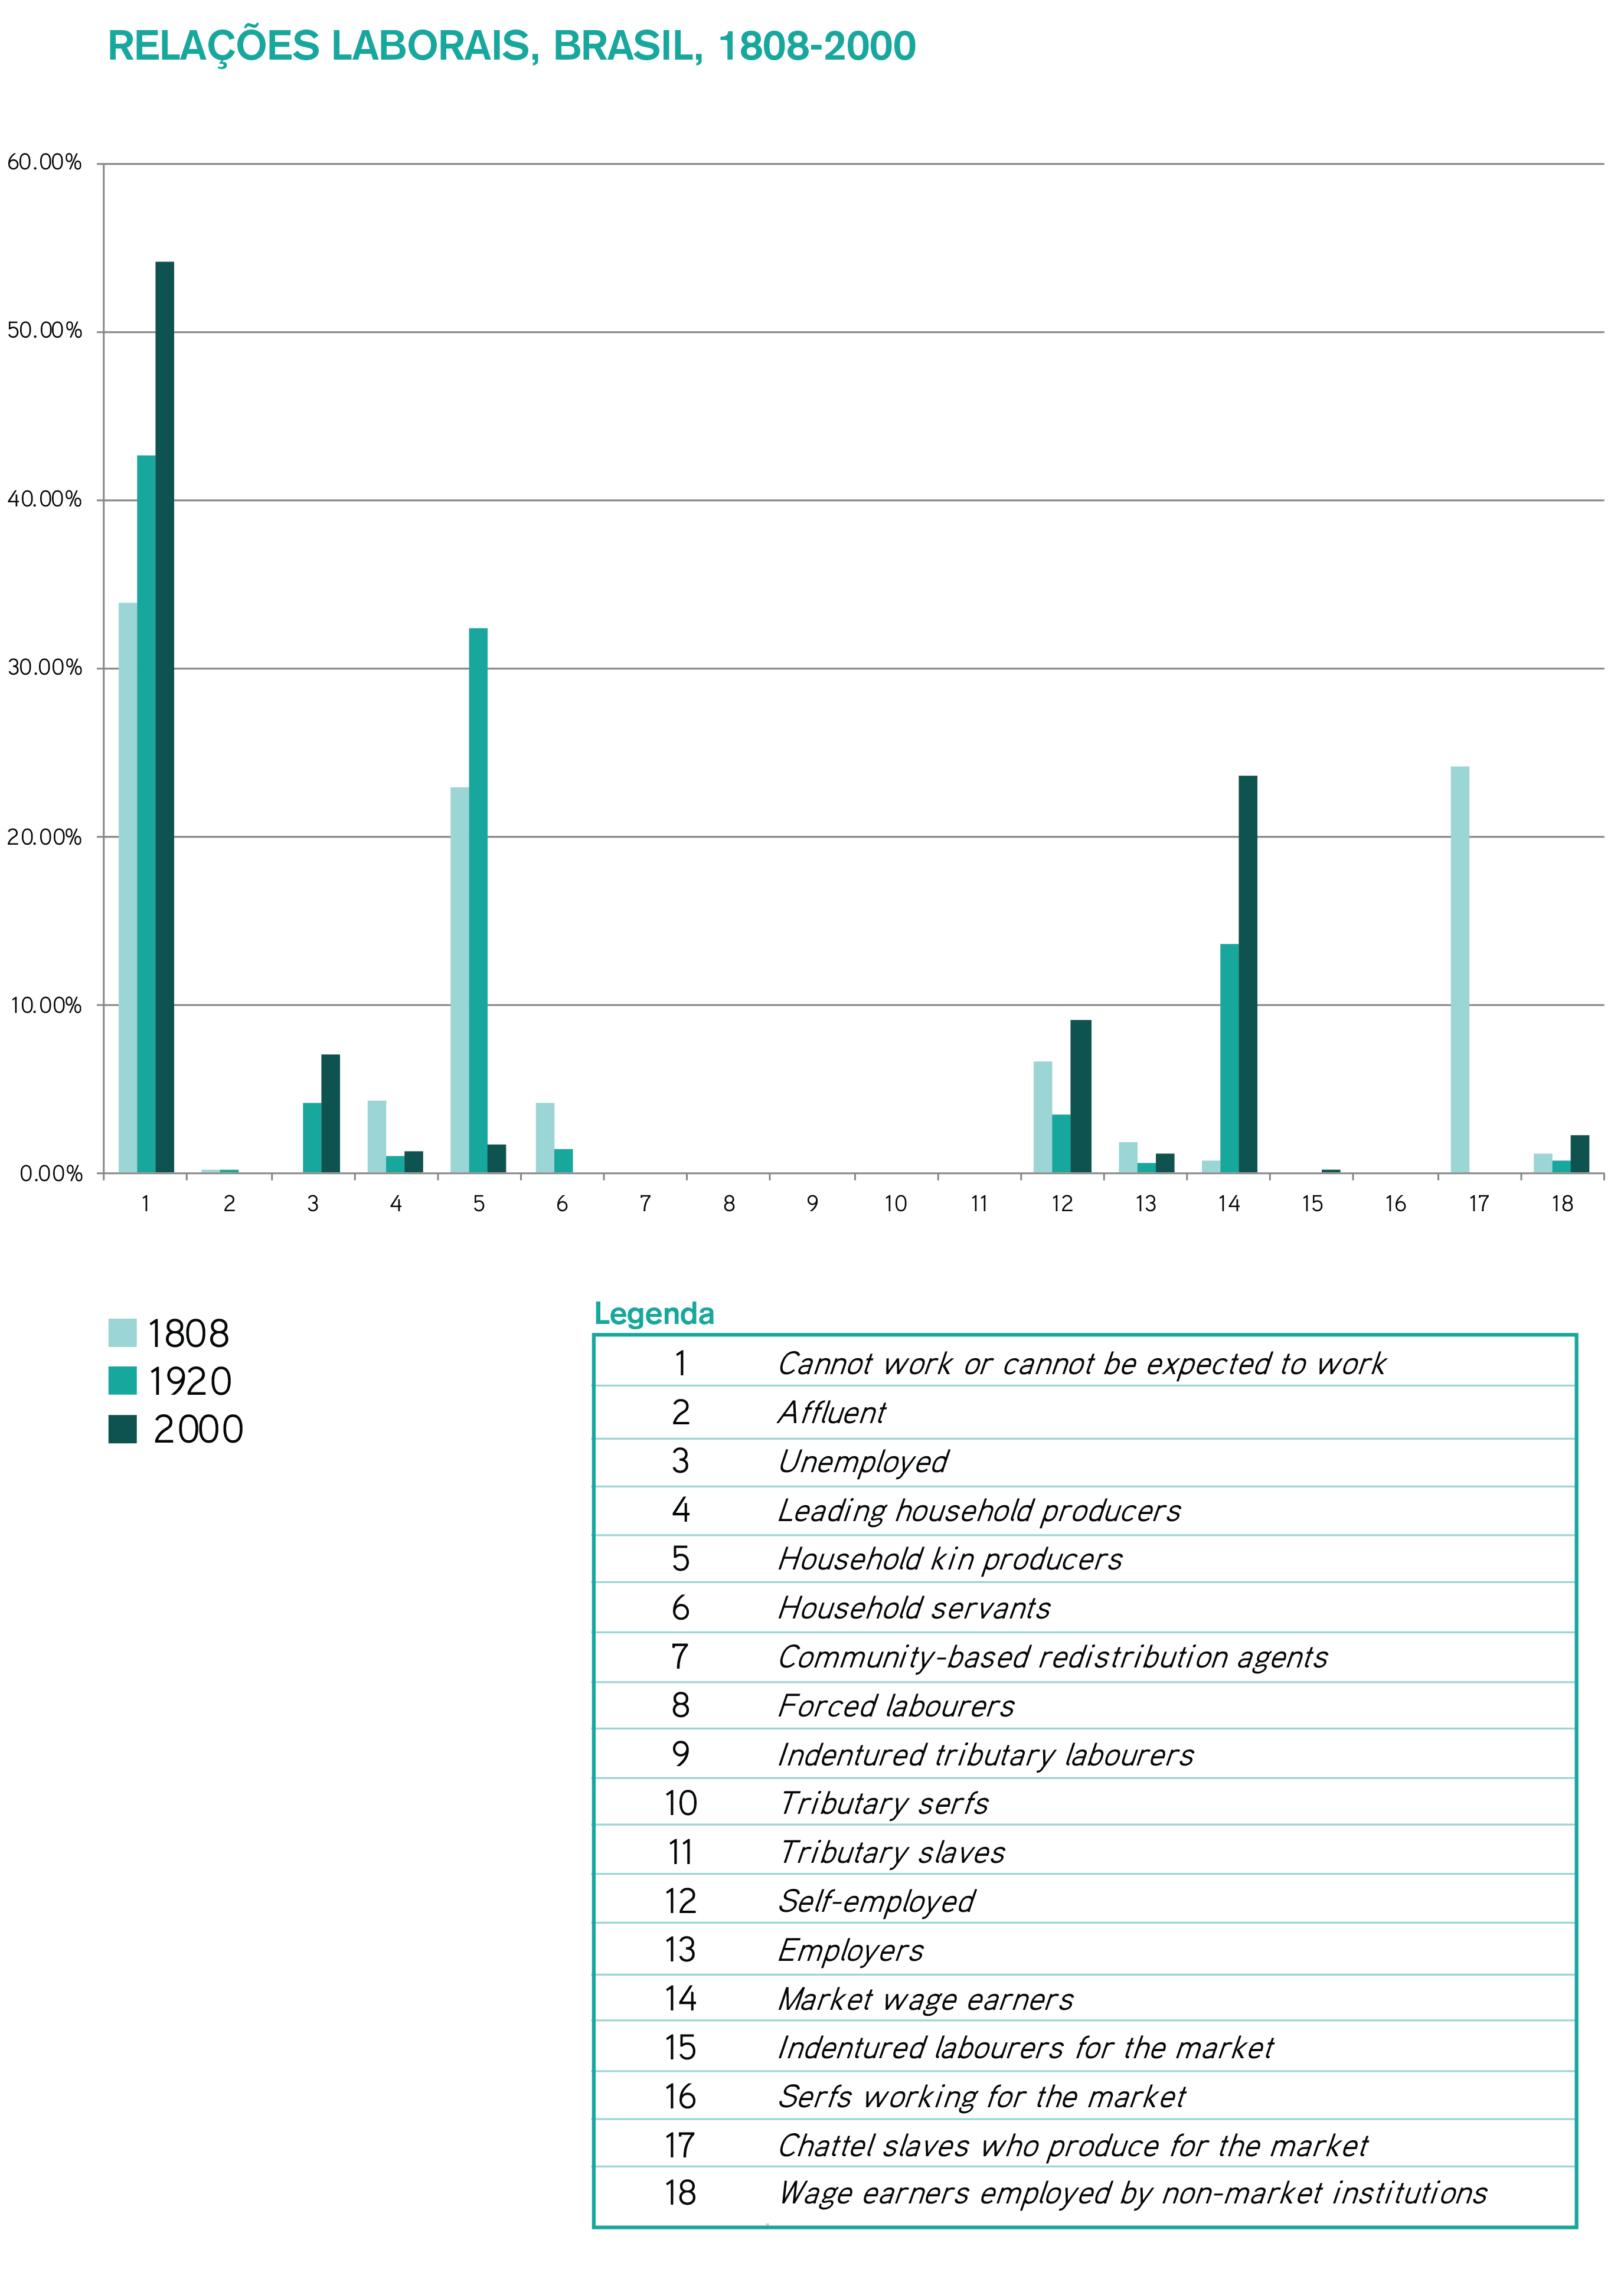
| Cannot work or cannot be expected to work | 33.80% | 42.65% | 54.18% |
| Affluent | 0.05% | 0.13% | 0.00% |
| Unemployed | 0.00% | 4.14% | 6.97% |
| Leading household producers | 4.30% | 1.04% | 1.23% |
| Household kin producers | 22.94% | 32.29% | 1.66% |
| Household servants | 4.21% | 1.36% | 0.00% |
| Community-based redistribution agents | 0.00% | 0.00% | 0.00% |
| Forced labourers | 0.00% | 0.00% | 0.00% |
| Indentured tributary labourers | 0.00% | 0.00% | 0.00% |
| Tributary serfs | 0.00% | 0.00% | 0.00% |
| Tributary slaves | 0.00% | 0.00% | 0.00% |
| Self-employed | 6.69% | 3.41% | 9.07% |
| Employers | 1.82% | 0.56% | 1.11% |
| Market wage earners | 0.79% | 13.67% | 23.56% |
| Indentured labourers for the market | 0.00% | 0.00% | 0.01% |
| Serfs working for the market | 0.00% | 0.00% | 0.00% |
| Chattel slaves who produce for the market | 24.20% | 0.00% | 0.00% |
| Wage earners employed by non-market institutions | 1.19% | 0.75% | 2.21% |


